Crypto swindlers smooth sailing ‘to the moon’ in 2022? A considerable spike in data breaches, identity theft, and crypto-related money laundering amid war and economic turmoil.
There were a record number of complaints as Americans see a 7% year-over-year increase in cybercrimes, with approximately $11 billion in reported losses since the start of the COVID-19 pandemic. More than 46% of the losses were related to cryptocurrency, as crypto theft rose by 600%.
In the first three months of 2022 alone, hackers have stolen over $700 million in crypto assets. With Ukraine having received more than $135 million in crypto donations between February 22 and March 28, and about half of the crypto-donation campaigns being obvious scams, there are certainly plenty of opportunities for blockchain hackers to exploit crisis-related vulnerabilities.
General Cyber Security Statistics
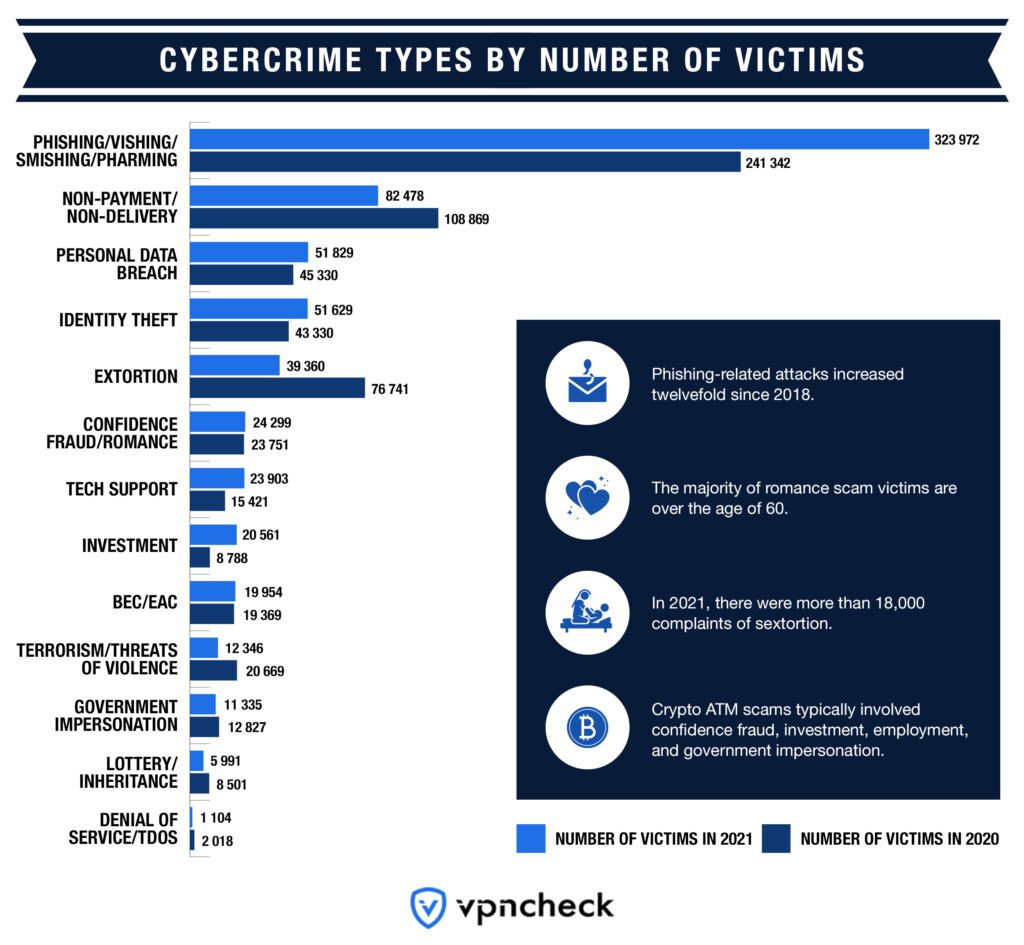
Cybercrime Types by Number of Victims
Overview of types of attacks and financial impact
The top 5 most fraudulent countries in Q1 2022 were Uzbekistan, the U.S., the Philippines, Thailand, and Ukraine.
According to the 2021 FBI Internet Crime Complaint Center (IC3) report, there was a YOY increase of over 22% in the total losses due to business email compromise and email account compromise (BEC/EAC).
While only being the 9th most common cybercrime by victim count, BEC/EAC losses amounted to nearly $2.4 billion – the most significant recorded losses of any category of cybercrime.
Collectively, the financial impact from the 5 most common cybercrimes amounted to $1.2 billion in losses in 2021.
Phishing/vishing/smishing/pharming, non-payment and non-delivery, personal data breaches, identity theft, and extortion made up the 5 most common cybercrimes by victim count – amounting to nearly 550,000 victims with legitimate losses.
Phishing/vishing/smishing/pharming accounted for 323,972 victims of cyber attacks in 2021.
The platforms or tools used to commit cybercrimes, particularly social media and virtual currency, immediately followed the 5 most common cybercrimes on the list with victim counts of 36,034 and 34,202, respectively.
The number of victims from malware/scareware has been on the decline since 2019.
According to IBM X-Force, ransomware was the most common form of cyber attack on operational technology (21% of all attacks), followed by server access (14%) and BEC (8%).
Compared to 2020 and early 2021, ransomware attacks (-2% YOY) and the share of illicit cryptocurrency transactions are on the decline. This trend continued in early 2022.
18% of complaints involving confidence fraud and romance scams were lodged in connection with crypto and investment scams.
There was a net increase of 10% in fraud in the first quarter of the year, where crypto and fintech were the most prone to fraudulent activities.
Crypto fraud saw growth of more than 6%
Tech support fraud claimed over $347 million in losses in 2021, a 137% increase since the previous year.
Nearly 30% of code exploits occurred on audited platforms.
After the Hydra takedown and closure of RaidForums, there was a mass exodus of cybercriminals to other alternatives – such as BreachForums. A member of the LockBit 2.0 ransomware group also publicly suggested the creation of a “pirate bay” forum.
In 2021, Telegram saw a 100% increase in usage among cybercriminal networks.
Since the beginning of the COVID-19 pandemic, the FBI has recorded a 300% increase in cybercrime.
There are around 5,200 attacks every month on IoT devices.
70% of all fraudulent transactions related to digital banking happen on mobile devices.
Small DDoS attacks rose by 233% in 2021.
Nearly one-third of businesses with links to Russia said they have experienced cyber attacks since the start of the invasion and continue to suffer data breaches on a weekly basis.
In 2021, 72.5% of risky contact tracing apps had at least one insecure cryptographic algorithm, while 75% contained a tracker that had sent data to third parties.
Social engineering, as an attack vector, was responsible for an average total cost of $4.47 million.
Revenue from scamming skyrocketed by a whopping 82% in 2021.
Data breach trends
In Q1 2022, there were 404 reported data compromises that affected more than 20 million people. This marks the third consecutive year that the number of Q1 breaches has increased compared to that of the previous year. Despite this, it is interesting to note that the number of victims decreased by around 50% compared to early 2021.
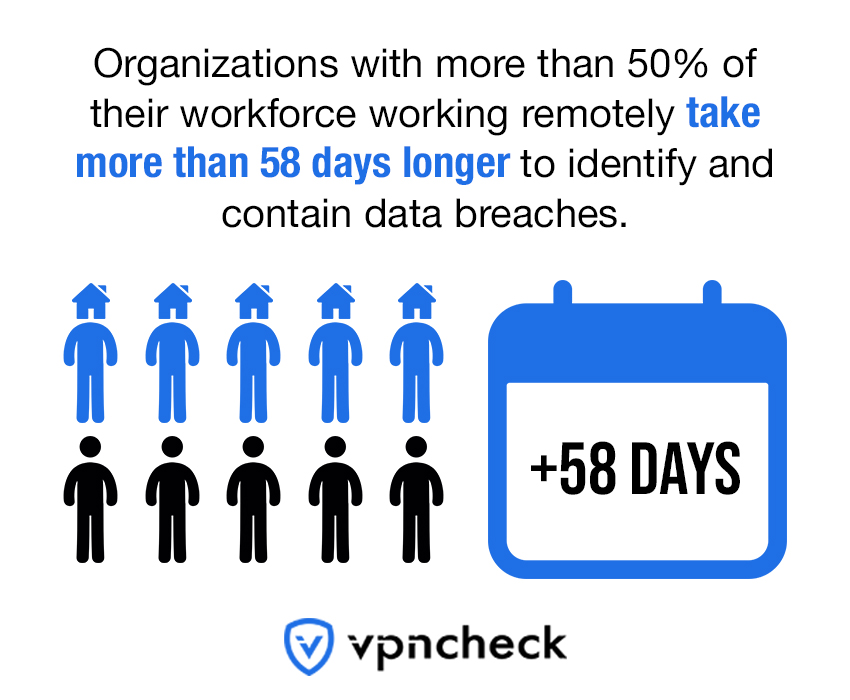
How Long It Takes to Contain Data Breaches When Employees Work From Home
The finance, healthcare, and manufacturing sectors saw the most data breaches in Q1 2022.
Data breaches from device theft and other physical attacks decreased to single digits in the first quarter of 2022.
Phishing attempts and ransomware contributed to the majority of data breaches due to cyber attacks.
There were nearly 52,000 victims of personal data breaches in 2021, which resulted in losses of more than $500 million.
Decentralized finance thefts increased by 1,330% in 2021.
While there was a 37% decline in the number of abuses, Canadian-listed registrar NameSilo still hosted the most abused domains in Q4 2021.
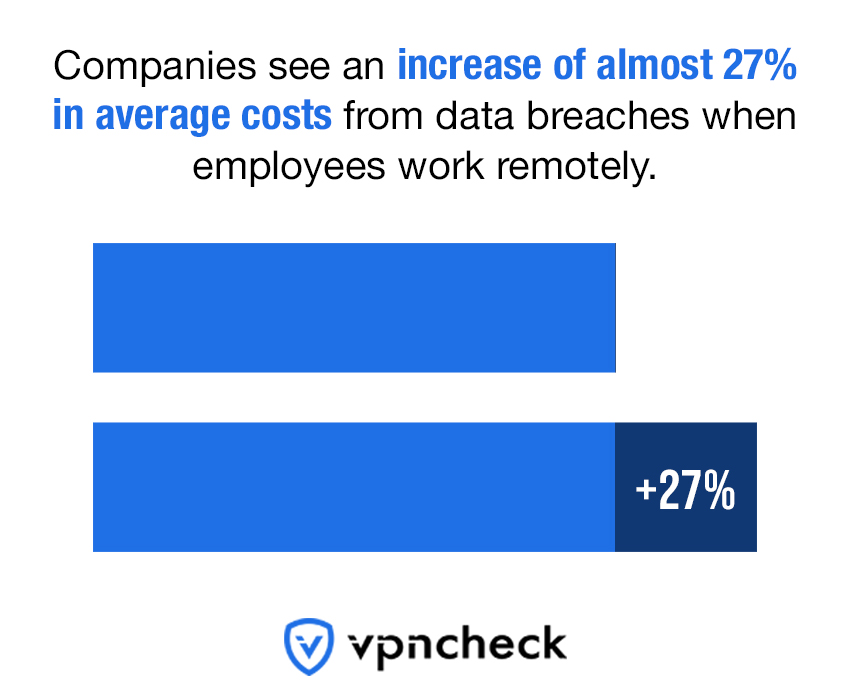
The average cost of data breaches at organizations with remote work policies is more than $1 million higher than organizations that do not permit working from home.
Data breaches in the public sector cost under $2 million in damages on average.
40% of data breaches in American companies led to legal issues.
20% of data breaches are caused by compromised credentials.
It takes 287 days on average to identify and contain a data breach.
The global average cost of a data breach in 2021 was $4.42 million – a 10% YOY increase compared to the previous year.
The average cost of a data breach for organizations with fully deployed AI and automated prevention systems is $2.90 million.
The top 5 countries/regions with the highest average total costs for data breaches were: 1) United States ($9.05 million), 2) the Middle East ($6.93 million), 3) Canada ($5.40 million), 4) Germany ($4.89 million), 5) Japan ($4.69 million).
At an average cost of $180, customer PII was the costliest type of stolen data in 2021.
Compromised credentials make up 20% of all breaches.
Over 46 million websites use SSL certificates by default.
Cost and risks of cyber security
Cost of Data Breaches When Employees Work From Home
The average cost of a data breach at organizations where more than 80% of the workforce works remotely is $5.54 million.
It is estimated that organizations will spend a total of $172 billion on information security in 2022.
Venture capital deals for cyber security organizations amount to approximately $31.8 million on average.
The cyber security insurance market is currently worth around $11.4 billion.
The average salary of a cybersecurity professional in North America is over $100,000.
The total average cost of a ransomware breach, without the ransom, is $4.62 million.
The average cyber insurance premium in 2021 increased by 180%.
Top 5 Threats in 2022
Identity theft and fraud – Reports of identity crime increased by 250%.
Cryptojacking and cryptoscams – Cases of crypto theft up by 600%.
Botnets – Botnets constituted 31% of recent cyber security threats/attacks.
Phishing/vishing/smishing/pharming – The total annual number of reported attacks increased by 33%.
Remote Code Execution (RCE) vulnerabilities – The number of vulnerabilities classified as widespread threats doubled since 2020.
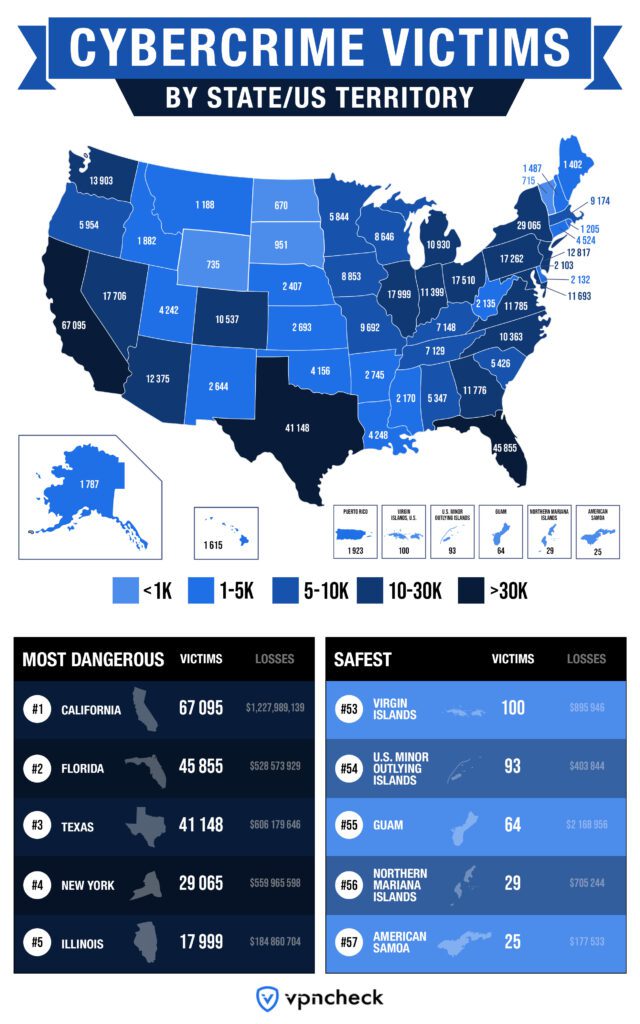
Victim States and Territories
Cybercrime Victims by State/U.S. Territory
Californians are cybercriminals' prime target in the United States. Over the past 3 years, the state of California has recorded both the highest number of victims and the greatest losses from various cyber crimes, amounting to 67,095 victims and over $1.2 billion in losses.
Supply chain attacks rose by 42% in the U.S.
69% of all critical national infrastructure attacks occur in the United States.
U.S. government organizations reported nearly $18.8 billion in damages from 79 ransomware attacks in 2020.
Only 38% of local and state employees in the U.S. were trained in preventing ransomware attacks.
Top 10 safest states and American territories based on losses due to cyber attacks:
1. Maine $7,261,234
2. West Virginia $9,453,607
3. Vermont $9,826,787
4. Montana $10,107,283
5. Wyoming $10,249,609
6. Rhode Island $11,191,079
7. New Mexico $12,761,850
8. Alaska $13,070,648
9. Puerto Rico $14,650,062
10. Delaware $15,041,717
Top 10 most dangerous states and American territories based on losses due to cyber attacks:
1. California $1,227,989,139
2. Texas $606,179,646
3. New York $559,965,598
4. Florida $528,573,929
5. Pennsylvania $206,982,032
6. New Jersey $203,510,341
7. Illinois $184,860,704
8. Michigan $181,622,993
9. Virginia $172,767,012
10. Washington $157,454,331
Top 10 countries with the most victims from cyber attacks (based on FBI reports):
1. United States 466,501
2. United Kingdom 303,949
3. Canada 5,788
4. India 3,131
5. Australia 2,204
6. France 1,972
7. South Africa 1,790
8. Germany 1,429
9. Mexico 1,326
10. Brazil 1,053
Cyber Crimes Involving Crypto Assets
Victims have lost over $429 million from crypto/investment scams through ‘rom-cons’ and confidence fraud in 2021.
110 individuals collectively earned around $8.9 million by ‘wash trading’ NFTs in 2021.
$3.2 billion in cryptocurrency was stolen in 2021, which is approximately 6 times the amount recorded in 2020.
Infiltration of exchanges’ hot keys remains the most common form of crypto hacking.
A mere 0.15% of cryptocurrency transaction volume in 2021 was associated with illicit addresses.
36% of crypto scams were the result of rug pulls.
Decentralized financed systems are responsible for the bulk of crypo-related money laundering, recording a 2000% increase in usage for illicit transactions.
Cybercriminals laundered more than $30 billion in cryptocurrencies in the last 5 years.
Network Vulnerabilities
Log4Shell, also known as the most severe vulnerability ever, was a major threat to corporate networks last year. The exploit affected hundreds of millions of devices globally and was eventually patched in December. However, by March 2022, the vulnerability was still out there and still posed a threat to many as nearly 40% of Log4j downloads in the first quarter were vulnerable to Log4Shell.
With the emergence of the dangerous Spring4Shell vulnerability in March/April 2022, cyber security experts are urgently searching for new ways to better protect networks against zero-day exploits.
Ransomware statistics
Security-as-a-Service and cyber insurance are becoming increasingly popular, but so is Ransomware-as-a-Service. There have been reports that entire cybercriminal networks are turning to Telegram to conduct their unlawful activities over the past year, with a massive surge in hackers in Telegram groups since the onset of the economic sanctions against the Russian Federation. Researchers observed more than 6 times the number of Telegram groups the day after the invasion, 23% of which were formed to accommodate hackers. And while ransomware activity has been declining, the most dangerous ransomware groups are thriving on platforms such as Telegram.
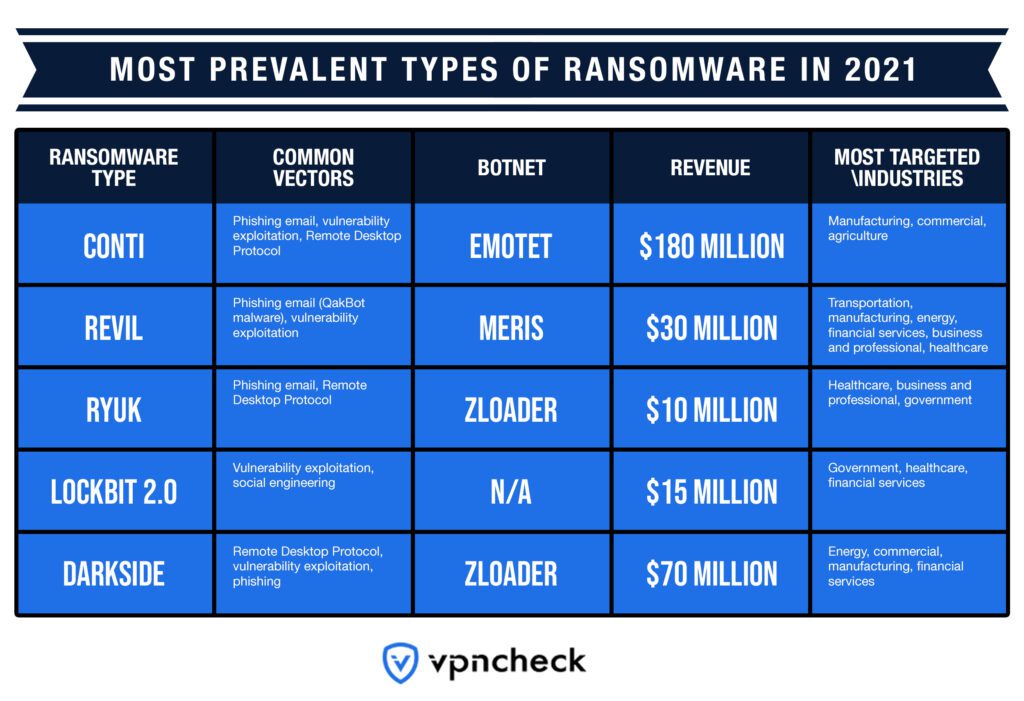
Most Prevalent Types of Ransomware
There was a 25% drop in ransomware activity in Q1 2022.
Conti was the biggest ransomware strain in 2021, as damages exceeded $180 million.
LockBit 2.0 accounted for more than 50% of successful ransomware attacks.
The decrease in Conti activity could be due to a Ukrainian leak in retaliation of Conti’s support for Russia.
The average ransomware payment is around $118,000.
Most ransomware strains laundered stolen funds through centralized exchanges.
The average ransomware strain is active for no more than 60 days. In 2017, ransomware strains lasted more than 8 times longer than in 2021.
While the RedLine credential stealer is still the biggest botnet-related malware threat, Droppers such as GCleaner are gaining ground at 4x the pace (QOQ) since the end of 2021.
The United States was the most targeted country in the world in ransomware attacks, as 39% of companies posted on data leak websites were U.S.-based. This number is 5 times greater than that of the UK, which was the second most targeted country based on ransomware victims.
In 2021, over $100 million in ransomware transactions occurred on a monthly basis.
There was an 82% increase in data leaks caused by ransomware in 2021.
Malware statistics
Trojans, clippers, cryptojackers, and info stealers are types of malware commonly used to steal crypto assets from victims.
Trojans made up over 50% of all malware in 2021.
The average cost of a malware attack on an organization is around $2.4 million.
62% of cyber crimes are malware-free.
23% of companies are very confident in their ability to resolve malware threats.
Nearly 75% of organizations are training their IT specialists to develop their understanding of malware analysis.
65% of surveyed IT decision-makers say that they are most concerned about email as a malware attack vector.
Approximately $5.6 million was lost in 2021 due to malware/scareware/viruses.
Nearly 66% of organizations outsource some of their malware analysis tasks to an MSSP.
Trickbot was the most prevalent malware family in 2021, as reports indicate that it was responsible for more than 11% of all malware-related attacks.
Formbook made up nearly 40% of all infostealer malware attacks in 2021.
XMRig was responsible for more than 40% of cryptomining malware attacks.
Only 1% of malware attacks in 2021 leveraged vulnerabilities, down from 11% in 2020, most of which occurred towards the end of the year.
Botnet statistics
In Q4 2021, Russia saw the largest increase (124%) in botnet control servers in the world. At 854 command and control (C&C) servers, Russia now hosts more than double the amount of servers when compared to the United States’ 381.
Russia and the United States continue to host the most botnet C&C servers in the world. In Q3 2021, Russia and the U.S. hosted 381 and 301 C&C servers, respectively.
In Q4 2021, the number of C&C botnet servers in Russia increased by 124% to a total of 854.
Almost 30% of all botnet C&C servers were hosted in Russia at the end of 2021.
In 2021, the Glupteba botnet infiltrated and compromised more than 1 million Windows systems. Glupteba is currently one of the most advanced botnets and is capable of weaponizing the blockchain through rapidly decoding backup control servers as soon as a C&C server is interrupted.
German-based registrars saw a 136% increase in the number of botnet control servers.
China’s Alibaba Inc recorded a 452% jump in botnet C&Cs in Q4 2021.
Social Engineering Statistics
Phishing statistics
Phishing was the second most common cyber attack vector in 2021.
Over 50% of IT professionals and executives reported that phishing attacks were the top threat to their preventative security measures.
In 2021, the most common formats of email attachments in attacks consisted of Office documents (38%), Archive (37%), and PDF (14%).
At least 65% of phishing groups make use of spear-phishing methods to infect devices.
Nearly $18,000 is lost every minute due to phishing attacks.
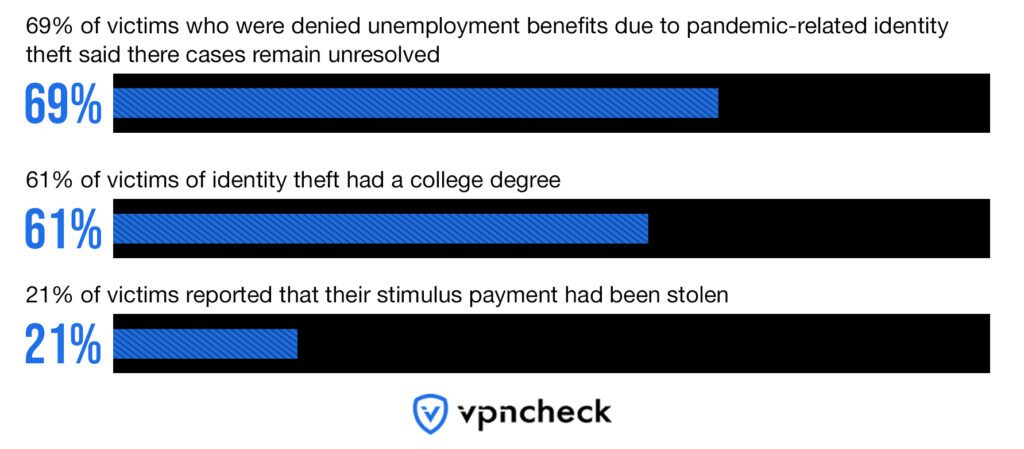
Identity theft and pandemic-related identity crime trends
Trends Among Victims of Social Engineering Attacks and Identity Fraud
33% of victims of COVID-related identity fraud did not have enough money to buy food.
33% of victims said they earned more than $50,000 per year.
86% of victims of identity crime had attended some college or graduated.
83% of victims of identity fraud were unable to rent an apartment or find accommodation.
Unemployment benefit fraud related to identity theft increased by at least 8% because of the pandemic.
21% of victims said they lost more than $20,000 to identity criminals.
75% of victims of COVID-related identity theft from 2020 said problems involving their cases were still unresolved in April 2022.
63% of new accounts opened in a victim’s name were credit cards.
77% of people who were victims of identity fraud currently delete scam emails and do not respond to text messages from strange numbers.
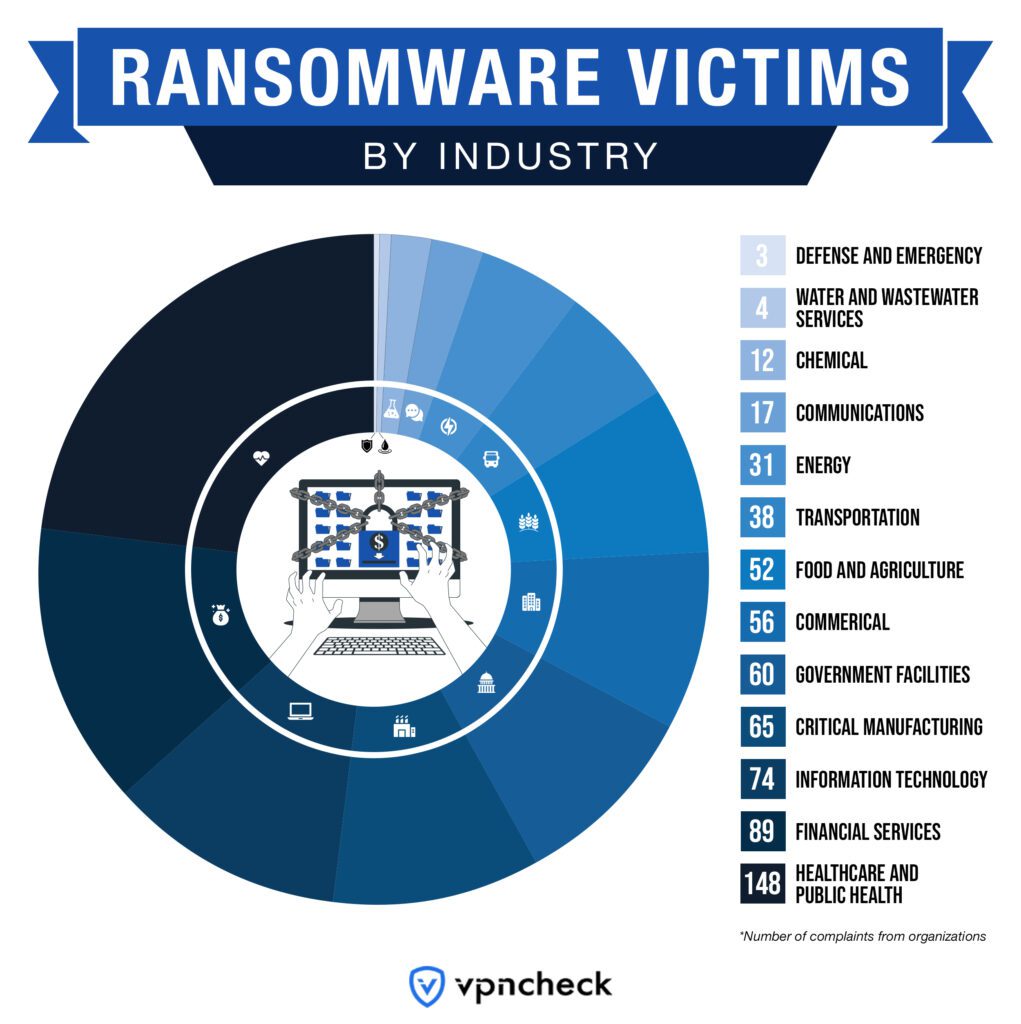
Impact on Industry
Ransomware Victims by Industry
The FBI received 148 ransomware complaints from healthcare and public health facilities. The healthcare sector also recorded the most ransomware attacks in 2021.
Since 2019, more than 90% of healthcare organizations have recorded a data breach that could have led to malicious code, DDoS interference, ransomware attacks, and more.
60% of medical devices are at the end-of-life stage and have no security updates available, leaving them vulnerable to attacks.
The cost of an attack in healthcare amounts to over $3.6 million on average.
64% of breaches in the hospitality industry occurred via corporate internal networks.
The number of attacks on the education sector grew by 75%.
61% of attacks on operational technology (OT) industries were in the manufacturing sector.
32% of cyber attacks in the manufacturing sector occurred in Asia.
Vulnerability exploitation accounted for 47% of attacks on the manufacturing industry.
At a comparatively low 1%, the heavy and civil engineering sector had the lowest share of OT attacks in 2021.
46% of the cyber attacks in the financial sector were due to phishing attacks.
70% of finance and insurance-related attacks were on banks.
Vulnerability exploitation was responsible for half of the reported attacks on the professional and business services industry.
25% of attacks on the energy sector were ransomware attacks.
Phishing was the most common vector hackers used to attack organizations within the energy sector, as phishing constituted 60% of attacks on organizations.
Recent Cyber Attacks and Breaches
January, 2022
Over half a million of Red Cross documents were compromised through a third-party hack in January 2022.
January, 2022
A Russian-linked threat actor accessed and attacked more than 70 websites of Ukrainian government agencies. Three different malware strains were identified, as well as the exploit of a Microsoft SQL Server vulnerability (CVE-2021-1636).
January, 2022
483 customer accounts at Crypto.com were compromised. The security breach resulted in a loss of 4,836.26 ETH, 443.93 BTC, and around $66,200.
February, 2022
The Harbour Plaza Hotel in Hong Kong reported a data leak of more than 1.2 million customers in a cyber attack in February.
February, 2022
The records of over 90,000 people who donated to GiveSendGo for the purpose of supporting Canadian truckers were accessed and published online by political hackers.
February, 2022
The EU, U.S., UK, and Canada claimed that Russia was behind a major cyber attack that disabled tens of thousands of Viasat network assets and modems used by Kyiv’s military.
March, 2022
Users of Axie Infinity, a popular game that rewards users in crypto, lost more than $600 million in a daring cyber heist.
March, 2022
Cyber security professionals have reported a 10x increase in attacks against Ukrainian networks. In 2021, Ukraine recorded more than 5,000 attacks from the Russian-linked Shuckworm group – who are continuing their efforts to compromise state-owned enterprises since the escalation of the conflict in 2022.
+
Post Content
Affiliate Commissions
If you follow a link from our website to purchase a service, vpncheck may receive a commission for referring you. The monetization has no bearing on the content of our reviews. You can read more here.